Like the MX3D bridge in Amsterdam, opened by Her Majesty Queen Máxima in 2021, one of the bridges on the University of Twente campus is equipped with a sophisticated network of sensors. Roland Kromanis is currently working with colleagues applying and calibrating the sensors on the UT campus bridge to measure its performance and, hence, resilience to its daily excitations.
“The smart sensors are installed to help us characterize the overall bridge response. Bridges respond to all sort of loadings. Two examples: 1. the load of a person running over the bridge, this causes the bridge to vibrate and deform due to the weight of the runner and 2. temperature changes during the day which occur due to the intensity of sunlight: an evening sun causes different expansions and contractions than a morning sun.” tells Roland about this project.
This year Roland and his team, the Structural health monitoring for smart infrastructure (SHM4SI) research group, collect sensory data to define the baseline responses of the bridge. Roland: “If you know how the bridge responds to different types of loads, such as dynamic, static and quasi-static loads, and you have a baseline response as an indication of the normal behaviour of the bridge, then you’re able to analyse its performance. You can easily see how peculiar responses stand out from the baseline and you’re able to determine current bridge conditions.”
Monitoring and characterizing responses to various types of loads facilitates detection of damages. “We have started monitoring the bridge in February. We are continuously collecting in real-time. We don’t expect to see peculiar responses right away. If a real-time data analysis is performed and a damage is detected immediately, that might indicate that the bridge is severely damaged or even “collapsed”. Usually damage propagates slowly”.
The sensors measure 5 types of information: the temperature of the bridge, tilt (i.e., inclination due to applied loads; short and long term); strains (how much the bridge element expands and contracts under loads (i.e., pedestrians and temperature); humidity (just in case); and vibrations. The vibrations are measured with numerous accelerometers, installed by colleagues from Mechanical Engineering department. The project is based on cross-department collaboration within the University of Twente as well.
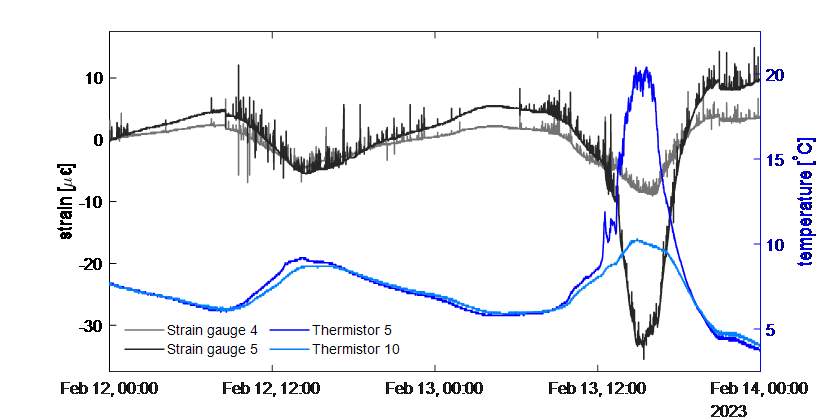
Bridge response (strain measurements) and temperatures are shown in the plot below. Sunday 12 February 2023 was a cloudy day. This is visible in temperature and strain measurements, which change a little during this day. The next day, Monday 13 February 2023, was a sunny day. In some places of the bridge, the temperature increased from 5 to 20°C, which is a lot. In shadowy locations, temperature variations were only 5°C. Strain measurements were closely following temperature variations. The small short spikes in strain measurements are caused by cyclists and pedestrians, the majority of them are seen at around 12:00 noon. However, the overall response of the bridge is governed by slowly changing temperature.
For the near future, we have a plan to strengthen some elements of the bridge, leading to a small change in its response. Such a change can be also seen as an anomaly or as damage. However, with the deluge of sensor data and the soon-to-be-developed methodology encompassing the knowledge of bridge load (cyclists, pedestrians and temperature) and response mechanism, the damage is anticipated to be detected quickly. Such information would be very beneficial for bridge management activities, including predictive maintenance and budget planning, and ultimately for the extension of the bridge’s life-span.
Article written by Nienke D. Nijenhuis.


